Fichye:Mauna Loa CO2 monthly mean concentration FR.svg

Fichye orijinal (Fichye SVG, rezolisyon de 708 × 708 piksèl, gwosè fichye : 439 kio)
Fichye sa a sòti nan Wikimedia Commons e ka sèvi nan lòt pwojè. Desktripsyon ki sou paj li file description page ekri anba a.
Kontni
Rezime
| DeskripsyonMauna Loa CO2 monthly mean concentration FR.svg |
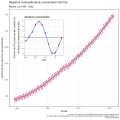
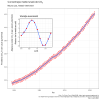
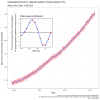
Français : Évolution de la teneur atmosphérique en dioxyde de carbone, mesurée depuis le volcan Mauna Loa, dans l'île de Hawaï. La courbe de cette évolution est connue sous le nom de « courbe de Keeling » et est une des preuves de la production humaine de gaz à effet de serre et de son impact sur le réchauffement climatique. C'est sur le Mauna Loa que les taux directs sont mesurés depuis le plus longtemps, mais on retrouve la même évolution sur d'autres sites dans le monde.
L'évolution de la concentration en CO2 est suivie quotidiennement à Mauna Loa depuis 1958. La courbe rouge montre la teneur moyenne mensuelle de dioxyde de carbone et la courbe bleu lisse cette tendance. La fluctuation intra-annuelle de dioxyde de carbone est due aux variations saisonnières causées par les plantes. Comme beaucoup de forêts se trouvent dans l'hémisphère nord, il y a plus de consommation de gaz carbonique de l'atmosphère durant l'été septentrional que pendant l'été austral. Ce cycle annuel est indiqué dans l'encart en haut à gauche de l'image et montre la concentration moyenne de gaz au cours des différents mois par rapport à la moyenne annuelle. Ce cycle se répète quelle que soit l'année observée. |
| Dat | |
| Sous | Travay pèsonèl. Données de Dr. Pieter Tans, NOAA/ESRL and Dr. Ralph Keeling, Scripps Institution of Oceanography. |
| Kreyatè | Oeneis |
| Autres versions |
[modifye]
Keeling curve
|
Créer ce graphique
R code
# Mauna Loa atmospheric CO2 change
# multi language plot for Wikipedia
# using different possible sources (Scripps if NOAA is not available)
#
# Used for https://commons.wikimedia.org/wiki/File:Mauna_Loa_CO2_monthly_mean_concentration.svg
# and related files in other languages. See all files in :
# https://commons.wikimedia.org/wiki/Template:Other_versions/Mauna_Loa_CO2_monthly_mean_concentration
#
# Update this script on :
# https://commons.wikimedia.org/w/index.php?title=Template:Other_versions/Mauna_Loa_CO2_monthly_mean_concentration.R&action=edit

# Required packages.   used for :
library(readr)         # reading data
library(dplyr)         # data processing
library(ggplot2)       # plot
library(gridExtra)     # plot positionning
library(scales)        # pretty breaks on plot axis
library(lubridate)     # date processing
library(httr)          # check url
library(Hmisc)         # ci from bootstrap

# install all locales beforehand, e.g. :
# sudo locale-gen ca_ES.UTF-8

old_locale <- Sys.getlocale("LC_TIME")

# Translations ------------------------------------------------------------

language <- list(

  ca_ES = list(
    locale_lc_time = "ca_ES.UTF-8",
    title = bquote("Mitjana mensual de la concentratió de"~CO[2]),
    subtitle = "Mauna Loa",
    caption_scripps = paste("dades : R. F. Keeling, S. J. Walker, S. C. Piper and A. F. Bollenbacher\nScripps CO2 Program (https://scrippsco2.ucsd.edu/). Visitada", Sys.Date()),
    caption_noaa = paste("dades : Dr. Pieter Tans, NOAA/ESRL (https://gml.noaa.gov/ccgg/trends/) i\n Dr. Ralph Keeling, Scripps Institution of Oceanography (https://scrippsco2.ucsd.edu/). Visitada ", Sys.Date()),
    x = "any",
    y = bquote("fracció de"~CO[2]~"en aire sec ("*mu*"mol/mol)"),
    x2 = "mes",
    y2 = bquote(atop("fracció de"~CO[2]~"en aire sec ("*mu*"mol/mol)",
                     "desviació de la mitjana anual")),
    title2 = "Variació mensual"
  ),

  cs_CZ = list(
    locale_lc_time = "cs_CZ.UTF-8",
    title = "Průměrné měsíční koncentrace oxidu uhličitého",
    subtitle = "Mauna Loa",
    caption_scripps = paste("data : R. F. Keeling, S. J. Walker, S. C. Piper a A. F. Bollenbacher\nScripps CO2 Program (https://scrippsco2.ucsd.edu/). Přístupné", Sys.Date()),
    caption_noaa = paste("data : Dr. Pieter Tans, NOAA/ESRL (https://gml.noaa.gov/ccgg/trends/) a\nDr. Ralph Keeling, Scripps Institution of Oceanography (https://scrippsco2.ucsd.edu/). Přístupné", Sys.Date()),
    x = "rok",
    y = bquote("koncentrace"~CO[2]~"v suchém vzduchu ("*mu*"mol/mol)"),
    x2 = "měsíc",
    y2 = bquote(atop("koncentrace"~CO[2]~"v suchém vzduchu ("*mu*"mol/mol)", "odchylka od ročního průměru")),
    title2 = "Měsíční změna (průměrná roční odchylka)"
  ),

  de_DE = list(
    locale_lc_time = "de_DE.UTF-8",
    title = bquote("Monatliche durchschnittliche"~CO[2]*"-Konzentration"),
    subtitle = "Mauna Loa",
    caption_scripps = paste("Datei : R. F. Keeling, S. J. Walker, S. C. Piper und A. F. Bollenbacher\nScripps CO2 Program (https://scrippsco2.ucsd.edu/). Zugänglich am", Sys.Date()),
    caption_noaa = paste("Datei : Dr. Pieter Tans, NOAA/ESRL (https://gml.noaa.gov/ccgg/trends/) und\nDr. Ralph Keeling, Scripps Institution of Oceanography (https://scrippsco2.ucsd.edu/). Zugänglich am", Sys.Date()),
    x = "Jahr",
    y = bquote(CO[2]*"-Anteil in trockener Luft ("*mu*"mol/mol)"),
    x2 = "Monate",
    y2 = bquote(atop(CO[2]*"-Anteil in trockener Luft ("*mu*"mol/mol)", "Abweichung vom Jahresmittel")),
    title2 = "Monatliche Variation"
  ),

  en_US = list(
    locale_lc_time = "en_US.UTF-8",
    title = bquote("Monthly mean"~CO[2]~"concentration"),
    subtitle = "Mauna Loa",
    caption_scripps = paste("Data : R. F. Keeling, S. J. Walker, S. C. Piper and A. F. Bollenbacher\nScripps CO2 Program (https://scrippsco2.ucsd.edu/). Accessed", Sys.Date()),
    caption_noaa = paste("Data : Dr. Pieter Tans, NOAA/ESRL (https://gml.noaa.gov/ccgg/trends/) and\n Dr. Ralph Keeling, Scripps Institution of Oceanography (https://scrippsco2.ucsd.edu/). Accessed ", Sys.Date()),
    x = "Year",
    y = bquote(CO[2]~"fraction in dry air ("*mu*"mol/mol)"),
    x2 = "Month",
    y2 = bquote(atop(CO[2]~"fraction in dry air ("*mu*"mol/mol)", "Departure from yearly average")),
    title2 = "Seasonal variation"
  ),

  es_ES = list(
    locale_lc_time = "es_ES.UTF-8",
    title = bquote("Media mensual de la concentración de"~CO[2]),
    subtitle = "Mauna Loa",
    caption_scripps = paste("dato : R. F. Keeling, S. J. Walker, S. C. Piper y A. F. Bollenbacher\nScripps CO2 Program (https://scrippsco2.ucsd.edu/). Visitada", Sys.Date()),
    caption_noaa = paste("dato : Dr. Pieter Tans, NOAA/ESRL (https://gml.noaa.gov/ccgg/trends/) y\nDr. Ralph Keeling, Scripps Institution of Oceanography (https://scrippsco2.ucsd.edu/). Visitada", Sys.Date()),
    x = "Año",
    y = bquote("Fraccion de"~CO[2]~"en aire secco ("*mu*"mol/mol)"),
    x2 = "Mes",
    y2 = bquote(atop("Fraccion de"~CO[2]~"en aire secco ("*mu*"mol/mol)", "Desviación de la media anual")),
    title2 = "Variación mensual"
  ),

  fr_FR = list(
    locale_lc_time = "fr_FR.UTF-8",
    title = bquote("Moyenne mensuelle de la concentration de"~CO[2]),
    subtitle = "Mauna Loa",
    caption_scripps = paste("données : R. F. Keeling, S. J. Walker, S. C. Piper et A. F. Bollenbacher\nScripps CO2 Program (https://scrippsco2.ucsd.edu/). Accédé le", Sys.Date()),
    caption_noaa = paste("données : Dr Pieter Tans, NOAA/ESRL (https://gml.noaa.gov/ccgg/trends/) et\n Dr. Ralph Keeling, Scripps Institution of Oceanography (https://scrippsco2.ucsd.edu/). Accédé le", Sys.Date()),
    x = "année",
    y = bquote("fraction de"~CO[2]~"dans l'air sec ("*mu*"mol/mol)"),
    x2 = "mois",
    y2 = bquote(atop("fraction de"~CO[2]~"dans l'air sec ("*mu*"mol/mol)", "en écart à la moyenne annuelle")),
    title2 = "Variation saisonnière"
  ),

    nl_NL = list(
    locale_lc_time = "nl_NL.UTF-8",
    title = bquote("Maandelijkse gemiddelde"~CO[2]*"-concentratie"),
    subtitle = "Mauna Loa",
    caption_scripps = glue("Gegevens : R. F. Keeling, S. J. Walker, S. C. Piper en A. F. Bollenbacher\nScripps CO2 Program (https://scrippsco2.ucsd.edu/). Geopend {Sys.Date()}"),
    caption_noaa = glue("Gegevens : Dr. Pieter Tans, NOAA/ESRL (https://gml.noaa.gov/ccgg/trends/) en\n Dr. Ralph Keeling, Scripps Institution of Oceanography (https://scrippsco2.ucsd.edu/). Accessed  {Sys.Date()}"),
    x = "Jaar",
    y = bquote(CO[2]*"-fractie in droge lucht ("*mu*"mol/mol)"),
    x2 = "Mannd",
    y2 = bquote(atop(CO[2]*"-fractie in droge lucht ("*mu*"mol/mol)", "Afwijking van jaargemiddelde")),
    title2 = "Seizoensgebonden variatie"
  ),

  nn_NO = list(
    locale_lc_time = "nn_NO.UTF-8",
    title = bquote("Gjennomsnittlig månedlig"~CO[2]*"-konsentrasjon"),
    subtitle = "Mauna Loa",
    caption_scripps = paste("data : R. F. Keeling, S. J. Walker, S. C. Piper og A. F. Bollenbacher\nScripps CO2 Program (https://scrippsco2.ucsd.edu/). Vist", Sys.Date()),
    caption_noaa = paste("data : Dr. Pieter Tans, NOAA/ESRL (https://gml.noaa.gov/ccgg/trends/) og\nDr. Ralph Keeling, Scripps Institution of Oceanography (https://scrippsco2.ucsd.edu/). Vist", Sys.Date()),
    x = "År",
    y = bquote(CO[2]*"-andel i tørr luft ("*mu*"mol/mol)"),
    x2 = "Måned",
    y2 = bquote(atop(CO[2]*"-andel i tørr luft ("*mu*"mol/mol)",
                     "Avvik fra årlig gjennomsnitt")),
    title2 = "Årlig variasjon"
  ),

  pl_PL = list(
    locale_lc_time = "pl_PL.UTF-8",
    title = bquote("Średnie miesięczne stężenie"~CO[2]),
    subtitle = "Mauna Loa",
    caption_scripps = paste("Dane : R. F. Keeling, S. J. Walker, S. C. Piper i A. F. Bollenbacher\nScripps CO2 Program (https://scrippsco2.ucsd.edu/). Dostęp na", Sys.Date()),
    caption_noaa = paste("Dane : Dr. Pieter Tans, NOAA/ESRL (https://gml.noaa.gov/ccgg/trends/) i\nDr. Ralph Keeling, Scripps Institution of Oceanography (https://scrippsco2.ucsd.edu/). Dostęp na", Sys.Date()),
    x = "Rok",
    y = bquote("Frakcja"~CO[2]~"w suchym powietrzu ("*mu*"mol/mol)"),
    x2 = "Miesiąc",
    y2 = bquote(atop("Frakcja"~CO[2]~"w suchym powietrzu ("*mu*"mol/mol)", "Odejście od średniej rocznej")),
    title2 = "Wahania sezonowe"
  ),

  ro_RO = list(
    locale_lc_time = "ro_RO.UTF-8",
    title = bquote("Concentrația medie lunară de"~CO[2]),
    subtitle = "Mauna Loa, Hawaii",
    caption_scripps = paste("Date: R. F. Keeling, S. J. Walker, S. C. Piper și A. F. Bollenbacher\nScripps CO2 Program (https://scrippsco2.ucsd.edu/). Accesat în", Sys.Date()),
    caption_noaa = paste("Date : Dr. Pieter Tans, NOAA/ESRL (https://gml.noaa.gov/ccgg/trends/) și\n Dr. Ralph Keeling, Scripps Institution of Oceanography (https://scrippsco2.ucsd.edu/). Accesat în", Sys.Date()),
    x = "An",
    y = bquote("Ponderea"~CO[2]~"în aer uscat ("*mu*"mol/mol)"),
    x2 = "Lună",
    y2 = bquote(atop("Abaterea cotei"~CO[2]~"în aer uscat ("*mu*"mol/mol)", "Abatere de la media anuală")),
    title2 = "Variație sezonieră"
  ),

  ru_RU = list(
    locale_lc_time = "ru_RU.UTF-8",
    title = bquote("Среднемесячная и среднегодовая концентрации"~CO[2]),
    subtitle = "Мауна Лоа, Гаваи",
    caption_scripps = paste("данные : R. F. Keeling, S. J. Walker, S. C. Piper и A. F. Bollenbacher\nScripps CO2 Program (https://scrippsco2.ucsd.edu/). доступ на", Sys.Date()),
    caption_noaa = paste("данные : Dr. Pieter Tans, NOAA/ESRL (https://gml.noaa.gov/ccgg/trends/) и\nDr. Ralph Keeling, Scripps Institution of Oceanography (https://scrippsco2.ucsd.edu/). доступ на ", Sys.Date()),
    x = "Годы",
    y = bquote("Доля"~CO[2]~"в сухом воздухе ("*mu*"mol/mol)"),
    x2 = "Месяцы",
    y2 = bquote(atop("Отклонение доли"~CO[2]~"в сухом воздухе", "от среднегодового значения, мкмоль/моль")),
    title2 = "Сезонные колебания"
  )

)


# Data --------------------------------------------------------------------

# First try NOAA data, if not availble use Scripps data
if (!http_error("ftp://aftp.cmdl.noaa.gov/products/trends/co2/co2_mm_mlo.txt")) {
  # https://gml.noaa.gov/ccgg/trends/data.html
  source <- "noaa"
  co2ml <- read_table(
    "ftp://aftp.cmdl.noaa.gov/products/trends/co2/co2_mm_mlo.txt",
    col_names = c("year", "month", "decimal", "average", "deseason", "ndays", "stddays", "unc"),
    col_types = "iidddidd",
    na = c("-99.99", "-1"),
    comment = "#") %>%
    group_by(year) %>%
    mutate(year_mean = mean(average, na.rm = TRUE),
           delta = average - year_mean,
           vdate = ymd(paste0("2015-", month, "-01")))%>%
    rename(co2 = average)

} else {
  # https://scrippsco2.ucsd.edu/data/atmospheric_co2/primary_mlo_co2_record
  # used during US gov shutdown
  source <- "scripps"
  co2ml <- read_csv(
    "https://scrippsco2.ucsd.edu/assets/data/atmospheric/stations/in_situ_co2/monthly/monthly_in_situ_co2_mlo.csv",
    col_names = c("year", "month", "xls_date", "decimal",
                  "co2_raw", "co2_raw_seas_adj", "fit", "fit_seas_adj",
                  "co2_filled", "co2_filled_seas_adj"),
    col_types = "iiiddddddd",
    skip = 57,
    na = "-99.99",
    comment = "\"") %>%
    group_by(year) %>%
    mutate(year_mean = mean(co2_filled, na.rm = TRUE),
           delta = co2_filled - year_mean,
           vdate = ymd(paste0("2015-", month, "-01"))) %>%
    rename(co2 = co2_filled)
}


# Generate the plot for each language -------------------------------------

for (l in names(language)) {
  message(l)
  current <- language[[l]]

  # format the date in local names
  Sys.setlocale("LC_TIME", current$locale_lc_time)

  # main plot
  p1 <- ggplot(co2ml, aes(decimal, co2)) +
    geom_line(color = "pink") +
    geom_point(color = "red", size = 0.6) +
    stat_smooth(span = 0.1) +
    scale_x_continuous(breaks = pretty_breaks()) +
    scale_y_continuous(breaks = pretty_breaks()) +
    labs(x = current$x,
         y = current$y,
         title = current$title,
         subtitle = paste(current$subtitle, min(co2ml$year), "-", max(co2ml$year)),
         caption = paste(current[[paste0("caption_", source)]],
                         "https://w.wiki/4ZWn", sep = "\n")) +
    theme_bw() +
    theme(plot.caption = element_text(size = 7))

  # inset plot
  p2 <- ggplot(co2ml, aes(vdate, delta)) +
    geom_hline(yintercept = 0) +
    stat_smooth(span = 0.4, se = FALSE) +
    stat_summary(fun.data = "mean_cl_boot", colour = "red", size = 0.3) +
    scale_x_date(breaks = pretty_breaks(4),
                 minor_breaks = pretty_breaks(12),
                 labels = date_format("%b")) +
    labs(x = current$x2,
         y = current$y2,
         title = current$title2) +
    theme_bw()

  # merge the plots and export in SVG
  p1 + annotation_custom(grob = ggplotGrob(p2),
                         xmin = 1957, xmax = 1991, ymin = 361, ymax = 420)

  ggsave(file = paste("co2_mauna_loa", l, Sys.Date(), "wp.svg", sep = "_"),
         width = 20,
         height = 20,
         units = "cm",
         device = svg)
}

# return to former locale
Sys.setlocale("LC_TIME", old_locale)
| Position de l'objet | 19° 32′ 10,31″ N, 155° 34′ 36,84″ O | Voir cet endroit et d’autres images sur : OpenStreetMap |
|---|
Kondisyon itlizasyon
- Ou gen dwa:
- pou pataje – pou kopye, distribiye epi difize ouvraj la
- pou remiks – pou adapte ouvraj la
- Selon kondisyon sa a yo:
- Rekonèt avèk non otè – Ou dwe bay enfòmasyon apwopriye sou otè a, bay yon lyen pou lisans lan, epi endike si te gen chanjman ki fèt. Ou ka fè sa nan nenpòt fason rezonab, men okenn fason ki sijere ke otè a soutni oswa apwouve itilizasyon ou an.
- Enfòmasyon sa yo ka pataje – Si ou fè rekopye, transfòme, oswa baze sou materyèl sa, ou dwe distribye kontribisyon ou anba menm oswa yon lisans konpatib avèk orijinal la.
Data source license
These data are made freely available to the public and the scientific community in the belief that their wide dissemination will lead to greater understanding and new scientific insights.
— Pieter Tans, in: NOAA
Légendes
Éléments décrits dans ce fichier
dépeint français
créé par français
Valeur sans élément de Wikidata
statut des droits d'auteur français
sous droit d'auteur français
source du fichier français
date de fondation ou de création français
31 desanm 2015
coordonnées du lieu représenté français
19°32'10.309"N, 155°34'36.840"W
type MIME français
image/svg+xml
Istorik fichye a
Klike sou yon dat/yon lè pou wè fichye a jan li te ye nan moman sa a.
| Dat ak lè | Minyati | Grandè yo | Itilizatè | Komantè | |
|---|---|---|---|---|---|
| Kounye a | 15 desanm 2023 à 19:46 |  | 708 × 708 (439 kio) | Oeneis | update 2023 |
| 22 desanm 2022 à 17:33 |  | 708 × 708 (433 kio) | Oeneis | 2022 update | |
| 15 out 2022 à 08:27 |  | 708 × 708 (433 kio) | Oeneis | update with 2022 data | |
| 16 desanm 2021 à 22:02 |  | 708 × 708 (429 kio) | Oeneis | update URLs | |
| 16 desanm 2021 à 19:47 |  | 708 × 708 (426 kio) | Oeneis | 2021 data | |
| 16 desanm 2021 à 19:46 |  | 708 × 708 (425 kio) | Oeneis | Reverted to version as of 17:50, 31 October 2020 (UTC) | |
| 16 desanm 2021 à 19:32 |  | 708 × 708 (426 kio) | Oeneis | 2021 data | |
| 31 oktòb 2020 à 17:50 |  | 708 × 708 (425 kio) | Oeneis | update data 2020-10-31 | |
| 20 jiyè 2019 à 14:42 |  | 708 × 708 (414 kio) | Oeneis | données jusqu'à 2019-06 | |
| 6 janvye 2019 à 11:06 |  | 708 × 708 (411 kio) | Oeneis | Données 2018 complètes. Données Scripps |
Itilizasyon fichye sa a
paj sa a itilize fichye sa a:
Itilizasyon global fichye a
Wiki sa a yo sèvi ak fichye sa a:
- Itilizasyon sou fr.wikipedia.org
- Itilizasyon sou oc.wikipedia.org
- Itilizasyon sou www.wikidata.org
Metadone
Fichye sa genyen enfòmasyon adisyonèl, petèt ki soti nan yon kamera dijital oubyen yon nimerizè itilize pou kreye oubyen dijitalize li. Si fichye sa te modifye depi kreyasyon li, kèk detay ka pa menm avèk original la.
| Largeur | 566pt |
|---|---|
| Hauteur | 566pt |


